Sentinel Study on a Shoestring
Want to set up a Microsoft Sentinel lab on PAYG pricing? This blog post aims to provide you with a few tips to keep the Azure bill as low as possible whilst still giving you a good test bed for learning how to set Microsoft Sentinel up.
A great feature of the modern public cloud is the ability to pay for what you need, whilst an enterprise organization may pay an ARM and a leg (*ba dum tss*) to set up monitoring with Microsoft Sentinel, us private tinkerers can make the most out of being able to deploy what we need on a small scale
What do we want to achieve with our Sentinel Instance?
Setting up a Sentinel instance will allow us to play around with KQL log searching and getting to know all the features of Sentinel. Towards the latter end of this post we will explore onboarding our own logs from a VM.
As an analyst, it is important to know where the logs come from and how that pipeline works. Not only will this help your general understanding of the environments you are monitoring, it will give you some experience that can be used when pivoting from analyst roles to engineering or architecture.
What can we do for free with Sentinel?
Each time you create a Log Analytics workspace, you can ingest up to 10GB/day of log data for free for the first 31 days. For anything lab related you would struggle to get near this amount, which means we can pull logs from multiple machines in when doing labs.
You can enable Microsoft Sentinel on your log analytics workspace for free during these 31 days. As long as you make sure to tear down any old workspaces this can be utilised forever for free Sentinel practice.
Before you begin, set a budget
Even though we are primarily working with free products, its best practice in Azure to set a budget to ensure any forgotten resources don’t create a massive bill.
Simply search for budgets in the Azure Portal and add a new budget, I usually set a £5 limit on my labs as I tear everything down once done. Your budget will act a safety net by sending an email if something has been left on, this way you can act on it and remove the resources before they start to cost too much.
Setting up Log Analytics & Microsoft Sentinel
To set up Microsoft Sentinel, we need to add this service on-top of a Log Analytics workspace. This is easily deployed by browsing to the ‘Sentinel’ service from your Azure Portal.
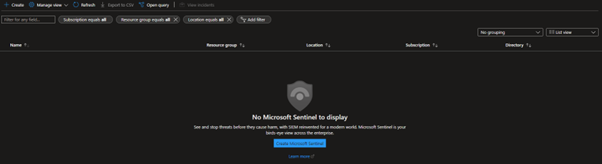
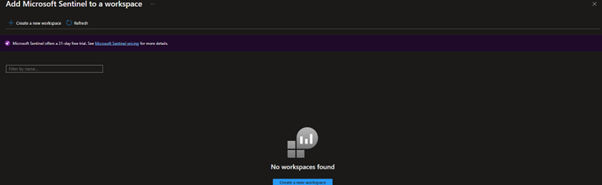
We will then be sent to a page to add Microsoft Sentinel to a Log Analytics workspace, if you already have one set up it will appear here. To continue setting up the lab hit ‘Create a new workspace’.
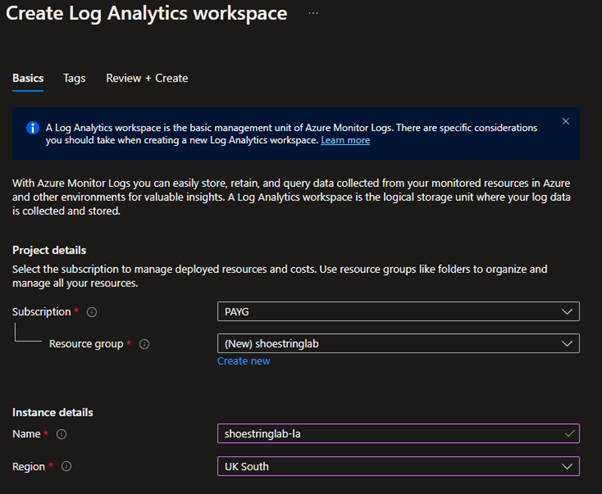
When creating a Log Analytics workspace normally, I suggest keeping it inside its own resource group, separate from other resources like virtual machines. However in this lab environment I have chosen to place everything in one resource group for easy cleanup.
Once the new resource group and Log Analytics workspace have deployed, you can refresh the ‘Add Microsoft Sentinel to a workspace’ page to see the newly created Log Analytics workspace.
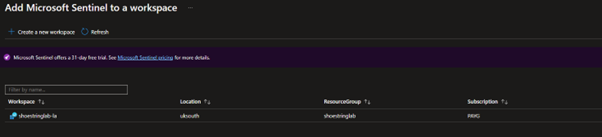
Select your workspace and then click ‘Add’ to add Sentinel on top of your workspace.
Setting up Log Analytics & Microsoft Sentinel
Cool! You’ve got yourself a Sentinel Instance, what now? We have a few options down the line for getting data in, if you’ve never done this before there is an easy way to get some training data and resources in.
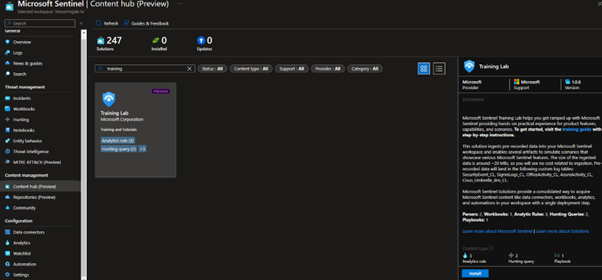
Under ‘Content management > Content hub’ you will find pre-packaged sets of analytic queries, playbooks and workbooks, usually built for certain 3rd party solutions/products. However, if we search for ‘training lab’ there is a package holding some training data to learn about the capabilities of Microsoft Sentinel.
These resources are created to go along with the Microsoft Sentinel Training Lab found on Github.
Please note, everything up until this point doesn’t have any cost associated. As we move on the resources
used may incur costs which I will estimate using the Azure Pricing Calculator.
Onboarding Logs From a Virtual Machine
If you have finished the labs, you may want to onboard your own logs. In this example we will onboard Linux syslog from an Azure Virtual Machine.
Setup
Start off by creating a new empty Sentinel instance, however this time do not install the ‘Training Lab Content’. We will then create a new virtual machine in Azure, if you haven’t done this before there is a guide here: Create a Linux VM in the Azure Portal.
For this lab all we need is a Standard B1ls VM running Ubuntu 20.04. To reduce the cost even further set the disk type to Standard HDD LRS. If built like this, the setup will cost you approximately £0.0068/hr.
With the VM running in the background, we can start ingesting our logs into Sentinel! In this example we will be onboarding syslog using Azure Monitor Agent. (Microsoft Monitoring Agent is being phased out next year, hence why this guide is using the new agent).
Ingesting with the logs with AMA (Azure Monitor Agent)
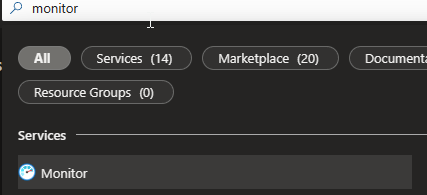
Search for ‘Monitor’ in the Azure Portal.
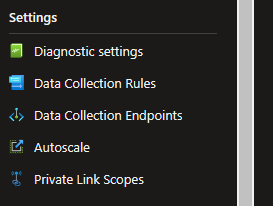
Scroll down along the left-hand side to ‘Settings’ then ‘Data Collection Rules’. Create a data collection rule.
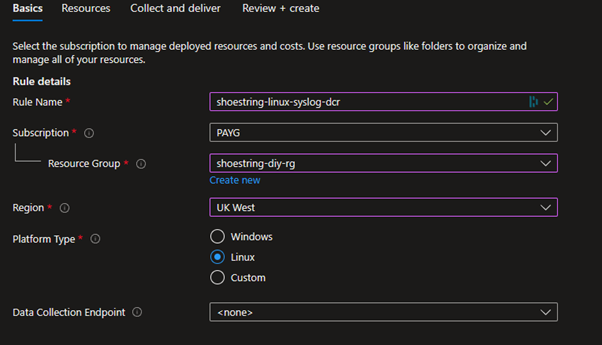
We want to set the platform type to ‘Linux’ to match the created VM.
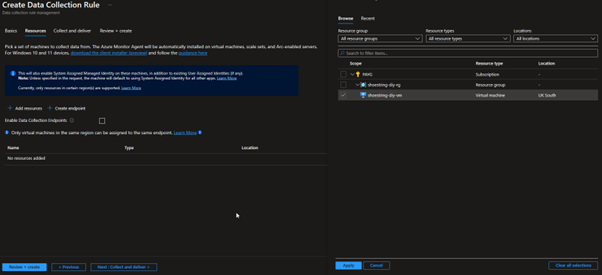
On the next section, click ‘Add resources’ and select the created VM in the ‘Scope’. It should be noted here that resource groups and subscriptions can also be selected to cover multiple assets.
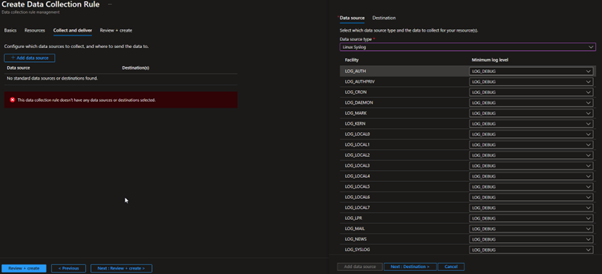
In the next section, click ‘Add data source’ and select ‘Linux Syslog’ as the data source type. With AMA we are able to change the logging levels to ensure we are only ingesting what we need. As this lab is on such a small scale we don’t need to get this deep as we have so much allowance for ingestion in the free trial.
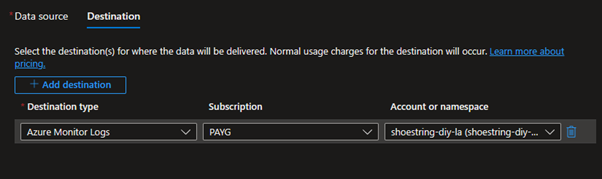
Click across to ‘Destination’ and ensure the ‘Account or namespace’ is set to your Log Analytics workspace. If this is not working, ensure the data collection rule is in the same region as your log analytics workspace. Once this is set up, click ‘Review and create’ to deploy the data collection rule.
This installs the Azure Monitor Agent on the virtual machine automatically and begins collection.
At this point, you could log into the Virtual Machine via SSH and run a few commands.
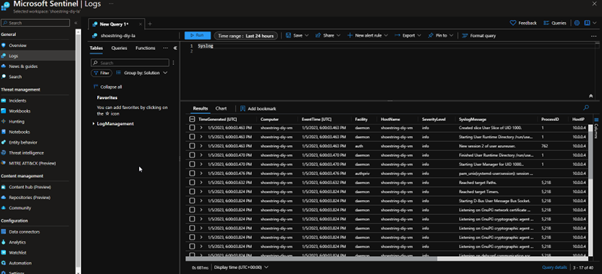
If we go back to our Sentinel instance and look at the ‘Syslog’ table, we will be able to see the logs coming in from the VM. If this doesn’t work, refreshing the page or closing the browser should sort it out, AMA can in some cases take some time to show logs, in this case it was within two minutes.
What next?
You’ve got the basics down, now its time to start honing your Kusto Query Language skills to search your data and create content such as analytics or hunting queries. A great place to get some inspiration is the Microsoft Sentinel Github.
This should give you a good start and a cheap home lab to begin your journey in Sentinel. Once you get good, you could even try going for SC-200 as Sentinel is 50%-55% of the exam.